A good indoor air quality graph offers a clear, visual view of trends and problem areas, making it easier for you to understand how your environment changes over time. Unlike gadget reviews, which focus on features, a graph shows the actual impact of your actions—like opening windows or using purifiers—helping you make smarter decisions. If you keep exploring, you’ll discover how ongoing visualization can transform your approach to indoor air health.
Key Takeaways
- A comprehensive graph offers an overall view of air quality trends, unlike isolated gadget reviews.
- Visualizations highlight patterns and fluctuations that single-device data may overlook.
- Graphs enable ongoing monitoring and assessment of interventions over time.
- They simplify complex data, making it easier to understand and act upon.
- One well-designed graph provides holistic insights, reducing the need for multiple device comparisons.
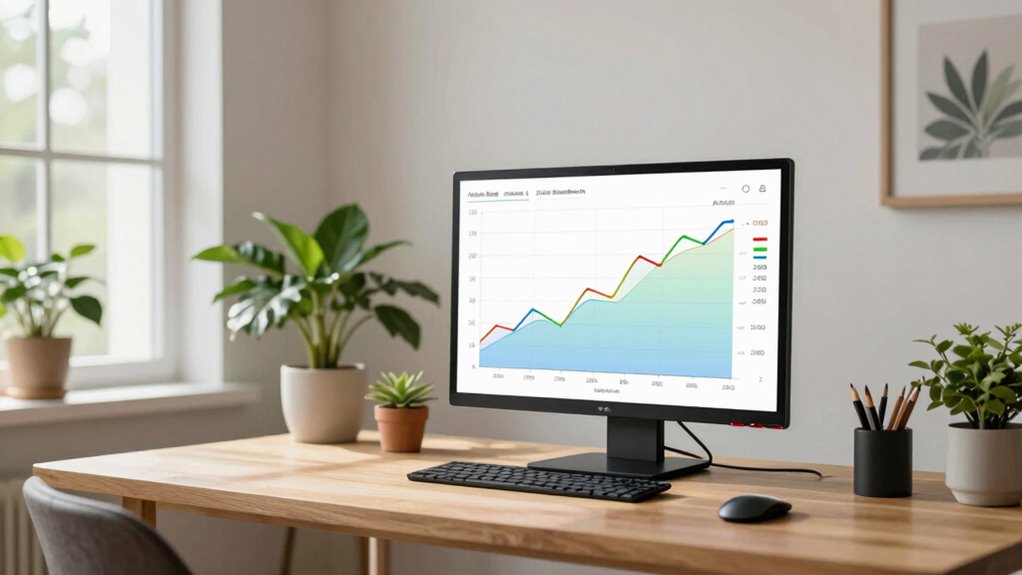
Indoor air graphs offer a clear way to understand and improve the air quality inside your home or workplace. Instead of relying solely on gadget reviews or generic data, these graphs give you a visual insight into what’s happening in your environment. They display air quality trends over time, making it easier to spot patterns, identify problem areas, and take targeted actions. Unlike many gadgets that simply provide raw numbers or alerts, a well-designed indoor air graph communicates complex information through intuitive data visualization techniques, transforming raw data into understandable visuals.
Indoor air graphs visually reveal trends, helping you identify issues and improve your environment effectively.
When you look at an indoor air graph, you’re not just seeing a bunch of numbers—you’re seeing a story unfold. The graphs highlight fluctuations in pollutants, humidity, and other factors that influence air quality, helping you understand how different activities or times of day impact your environment. For example, a spike in particulate matter during cleaning or cooking becomes immediately noticeable, prompting you to take steps to improve ventilation or adjust routines. This real-time or historical data visualization allows you to see air quality trends, so you can recognize whether conditions are improving or worsening, and make informed decisions accordingly. Incorporating air quality sensors into your monitoring setup enables more precise and continuous data collection, further enhancing the accuracy of your indoor air graphs.
A well-designed graph can also help you identify pollution sources, allowing you to target specific actions to improve your indoor environment more effectively.
Compared to gadget reviews, which often focus on features or specifications, an indoor air graph provides actionable insights. It bridges the gap between data and understanding, empowering you to make smarter choices about your indoor environment. Instead of guessing whether a device is effective or not, you see the actual impact of your efforts—like opening a window or adjusting an air purifier—through clear visual evidence. This makes the benefits of monitoring more tangible and personal.
Furthermore, these graphs foster a proactive approach to indoor air quality management. You can set benchmarks, monitor changes, and track the effectiveness of interventions over days, weeks, or months. This ongoing visualization helps you develop a holistic understanding of what influences your indoor air quality, beyond what a simple gadget review can offer. It’s about creating a continuous picture of your environment’s health, rather than evaluating a single device or feature. Recognizing the importance of data visualization techniques enhances your ability to interpret complex information easily and accurately.
In addition, understanding the air quality data provided by these graphs can help you better interpret the importance of ventilation and purification solutions in maintaining healthier indoor spaces. In essence, one good indoor air graph replaces the need for multiple gadget reviews by providing a complete view of your indoor air quality. It simplifies complex data through visualization techniques that are both accessible and meaningful. With this tool, you’re better equipped to maintain a healthier, more comfortable indoor space—making it a smarter, more insightful investment than just relying on a gadget’s specifications.

BREATHE Airmonitor Plus Indoor Air Quality Monitor – Smart CO2, PM1 PM2.5 PM10, VOC & Formaldehyde Sensor | Professional-Grade Air Monitor with App
PROFESSIONAL INDOOR AIR QUALITY MONITORING: Accurately track CO₂, PM1, PM2.5, PM10, TVOC, Formaldehyde (HCHO), Temperature and Humidity in…
As an affiliate, we earn on qualifying purchases.
As an affiliate, we earn on qualifying purchases.
Frequently Asked Questions
How Often Should I Update My Indoor Air Graph?
You should update your indoor air graph regularly, ideally every few days, to guarantee accurate data visualization. Frequent updates account for sensor calibration changes and environmental shifts. Check your device’s recommendations for calibration intervals and keep an eye on sensor performance. This way, your graph provides reliable insights into indoor air quality, helping you make informed decisions and maintain healthier living conditions.
Can Indoor Air Graphs Detect Specific Pollutants?
Indoor air graphs often struggle with pollutant specificity, meaning they can’t always identify specific pollutants accurately. While they provide useful overall air quality trends, detection limitations prevent pinpointing particular contaminants like VOCs or allergens. You might see general pollution levels rise, but for detailed detection of specific pollutants, you’d need specialized sensors. Relying solely on an indoor air graph may overlook certain pollutants, so consider supplementing with targeted testing.
Are Indoor Air Graphs Suitable for Large Spaces?
Indoor air graphs are suitable for large spaces because they provide real-time air quality data, helping you identify pollution levels across the area. They allow you to manage space effectively by pinpointing zones with poor air quality, so you can take targeted action. Unlike gadgets that just monitor, these graphs give you an all-inclusive view, making space management easier and ensuring healthier indoor environments for everyone.
Do Indoor Air Graphs Require Professional Installation?
Indoor air graphs are like a map guiding you through unseen territory; they typically don’t need professional installation. You just set up the sensor, confirm proper calibration, and enjoy clear data visualization. As long as you follow the instructions, you can easily monitor your air quality. Professional help isn’t usually necessary, making it simple to keep an eye on your indoor environment without extra hassle.
How Accurate Are Indoor Air Graphs Compared to Gadgets?
Indoor air graphs are generally more accurate than gadgets because they use advanced sensor technology designed for precise air quality measurement. These graphs provide a detailed, real-time view of your indoor environment, helping you understand fluctuations and identify issues better than most gadgets. While gadgets can be helpful, indoor air graphs are tailored for accuracy and thorough data, making them a more reliable tool for monitoring your air quality effectively.

Air Quality Monitor Indoor, 10-in-1 Portable Smart Air Quality Tester
【Professional 10-in-1 Air Quality Monitor】This professional 10-in-1 air quality monitor accurately measures carbon dioxide (CO2), formaldehyde (HCHO), total…
As an affiliate, we earn on qualifying purchases.
As an affiliate, we earn on qualifying purchases.
Conclusion
A good indoor air graph helps you see patterns and pinpoint issues faster than just reading gadget reviews. Did you know that poor indoor air quality can be linked to headaches, fatigue, and even long-term health problems? By understanding your air data, you can make smarter decisions to improve your home’s environment. This simple visual tool empowers you to take control—more effective than relying solely on gadget hype. Ultimately, a clear graph keeps your air healthier and your mind at ease.

Air Purifier for Large Room, Cleans 2,400 ft² in 30 Mins, 3-Stage True HEPA, 360° Airflow, Large Touch Display Control, Real-Time Air Quality (PM2.5) Display, Ultra-Quiet 20dB Sleep Mode, HAP602 White
Air Quality Monitoring: This air purifier is designed with a built-in PM2.5 sensor and real-time display, eliminating the…
As an affiliate, we earn on qualifying purchases.
As an affiliate, we earn on qualifying purchases.

Temtop PM2.5 Monitor P600, Essential Air Particle Meter PM2.5 PM10 Air Quality Tester for Indoor/Outdoor Air Pollution Detection, Particle-Centric Detector w/Data Histogram Display
UPGRADED SENSOR: Adopting Temtop second-generation PM2.5 particle laser sensor, directly transform the PM2.5 & PM10 concentration into visual…
As an affiliate, we earn on qualifying purchases.
As an affiliate, we earn on qualifying purchases.