To create a simple IAQ dashboard without tech skills, start by choosing user-friendly tools like Google Sheets or Airtable. Log your sensor readings regularly and use built-in features to create easy-to-understand charts or color-coded indicators for air quality. Keep the layout simple and focus on key factors like CO2, humidity, and temperature. With some basic setup, you’ll be able to monitor your indoor environment easily—if you keep exploring, you’ll discover even more helpful tips.
Key Takeaways
- Use user-friendly tools like Google Sheets or Airtable to log sensor data without coding.
- Select plug-and-play sensors with Wi-Fi or Bluetooth for automatic data syncing.
- Set up simple visualizations such as color-coded charts to display temperature, humidity, CO2, and PM2.5 levels.
- Keep the dashboard layout clean and focus on key indicators for quick interpretation.
- Regularly review data and adjust ventilation or use air purifiers based on insights.
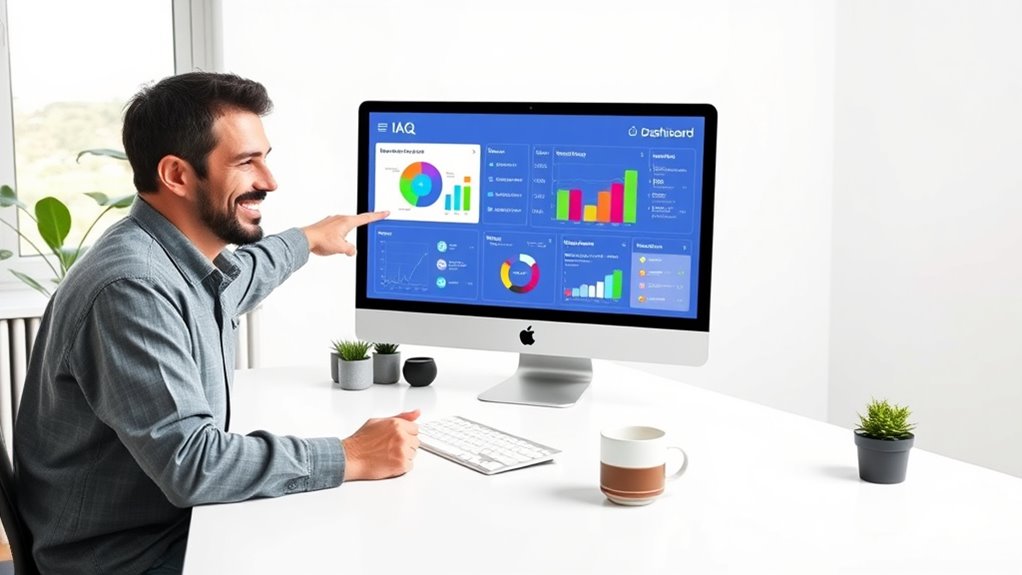
Creating a simple Indoor Air Quality (IAQ) dashboard can help you easily monitor and improve the air within your space. You don’t need to be a tech expert to set one up, and it doesn’t have to be complicated. The key is to keep things straightforward and focus on the most important data points. Start by identifying what air quality factors matter most to you—common ones include temperature, humidity, CO2 levels, and airborne pollutants like particulate matter (PM2.5). These indicators give you a clear picture of your indoor environment and help you make informed decisions about ventilation, cleaning, or adjusting your space’s climate.
Next, choose user-friendly tools that don’t require coding or technical knowledge. There are many free or affordable options, such as Google Sheets or simple dashboard platforms like Canva or Airtable. These tools let you create visual displays with minimal effort. For example, you might set up a spreadsheet that logs your sensor readings daily, then create simple graphs or charts to visualize trends over time. This way, you can catch issues early—like rising CO2 levels indicating poor ventilation or high humidity leading to mold growth—without needing complex software.
To get your data, consider using plug-and-play sensors designed for easy setup. Many sensors connect via Wi-Fi or Bluetooth and come with companion apps that automatically sync data to your phone or cloud account. Once you have your sensors in place, link their data feeds to your dashboard tool. If you’re using a spreadsheet, you can often export data from the sensor app and import it manually, or set up simple automation with tools like IFTTT or Zapier. These integrations streamline the process, so you don’t have to spend hours updating data manually.
It’s also helpful to understand indoor air quality factors and how they influence your health and comfort. As you build your dashboard, focus on clarity. Use color codes—green for good, yellow for caution, red for problems—to quickly identify areas that need attention. Keep the display simple, avoiding clutter or overly complex charts. The goal is to glance at your dashboard and instantly understand your indoor air quality status. Regularly review your data, and note patterns or sudden changes. If you notice consistent issues, take targeted actions—like increasing ventilation, using air purifiers, or adjusting humidity levels.
Creating this kind of dashboard is an empowering way to stay on top of your indoor environment without technical hurdles. It makes managing air quality accessible, even for those without specialized skills. By focusing on key indicators, choosing simple tools, and keeping your display clear, you’ll have a practical, easy-to-use system that helps you breathe easier and maintain a healthier indoor space.
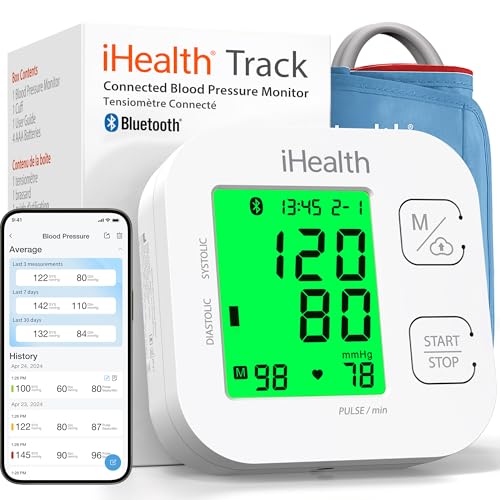
iHealth Track Smart Upper Arm Blood Pressure Monitor with Wide Range Cuff that fits Standard to Large Adult Arms, Bluetooth Compatible for iOS & Android Devices
Clinically Accurate: Easy Operation by two buttons, Advanced Accuracy, No Calibration required.
As an affiliate, we earn on qualifying purchases.
Frequently Asked Questions
Can I Customize the Dashboard Layout Easily?
Yes, you can customize the dashboard layout easily. Most IAQ tools offer drag-and-drop features, so you can move widgets, charts, and data panels around without any coding. You simply select the elements you want to change, drag them to your preferred spots, and adjust sizes as needed. This intuitive process makes it straightforward for you to personalize your dashboard, ensuring it displays the most relevant information clearly.
What Data Sources Are Compatible With the Dashboard?
You can connect your dashboard to various data sources like smart sensors, Excel files, or cloud services, making monitoring effortless. Imagine the peace of mind when real-time air quality updates flow seamlessly from your devices, yet it’s simple to set up without tech skills. This compatibility guarantees you stay informed, empowered, and in control, transforming complex data into clear insights you can trust and act on instantly.
How Often Should I Update the IAQ Data?
You should update your IAQ data at least once a day to guarantee accurate, real-time insights. If your environment experiences rapid changes, consider updating more frequently, like every few hours. Regular updates help you catch issues early and maintain a healthy indoor air quality. Automating data collection, if possible, simplifies this process, so you can focus on making informed decisions without constant manual input.
Is There a Mobile Version of the Dashboard?
Imagine carrying a pocket-sized radar for your indoor air quality—yes, there’s a mobile version of the dashboard. It’s designed to be responsive, so you can view real-time IAQ data on your phone or tablet, anytime and anywhere. Simply access it through your device’s browser or download a compatible app. This way, you stay connected to your environment, making informed decisions on the go, just like a modern-day sentinel.
Can Multiple Users Access the Dashboard Simultaneously?
Yes, multiple users can access your IAQ dashboard simultaneously if you choose a cloud-based platform or shared software. These options allow real-time collaboration, so everyone stays updated on indoor air quality data. Make sure your chosen tool supports multi-user access and permissions. This way, your team can monitor, analyze, and respond to IAQ metrics together without any hassle.
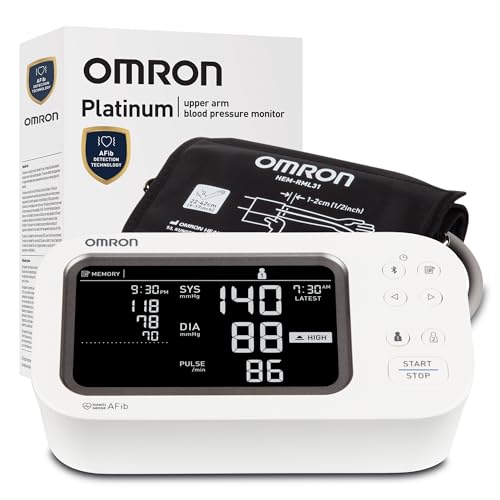
OMRON Platinum Blood Pressure Monitor for Home Use & Upper Arm Blood Pressure Cuff - #1 Doctor & Pharmacist Recommended Brand - Clinically Validated - AFib Detection - Connect App
CONFIDENCE IN EVERY READING: Monitor your heart health with the OMRON Platinum Upper Arm Blood Pressure Monitor's Advanced...
As an affiliate, we earn on qualifying purchases.
Conclusion
So, there you have it—building a simple IAQ dashboard without any tech skills is easier than breathing, or so you might think. Just follow these steps, and you’ll have a snazzy display in no time. Who knew that understanding your indoor air quality could be so straightforward? Now, you can impress friends with your tech prowess or just enjoy cleaner air—either way, you’re ahead of the game. Cheers to tech-light solutions!
Google Nest Thermostat - Smart Thermostat for Home - Programmable Wifi Thermostat - Charcoal
ENERGY STAR certified smart thermostat for home that helps you save energy and stay comfortable.Connectivity : Wi-Fi -...
As an affiliate, we earn on qualifying purchases.

Google Nest Learning Thermostat (4th gen) + Nest Temperature Sensor (2nd gen) - Obsidian
Nest’s smartest, most advanced thermostat yet, the Google Nest Learning Thermostat (4th gen) is a beautiful, brilliant way...
As an affiliate, we earn on qualifying purchases.